Porosity-Permeability Cross-Plot Analysis for Reservoir Quality Assessment
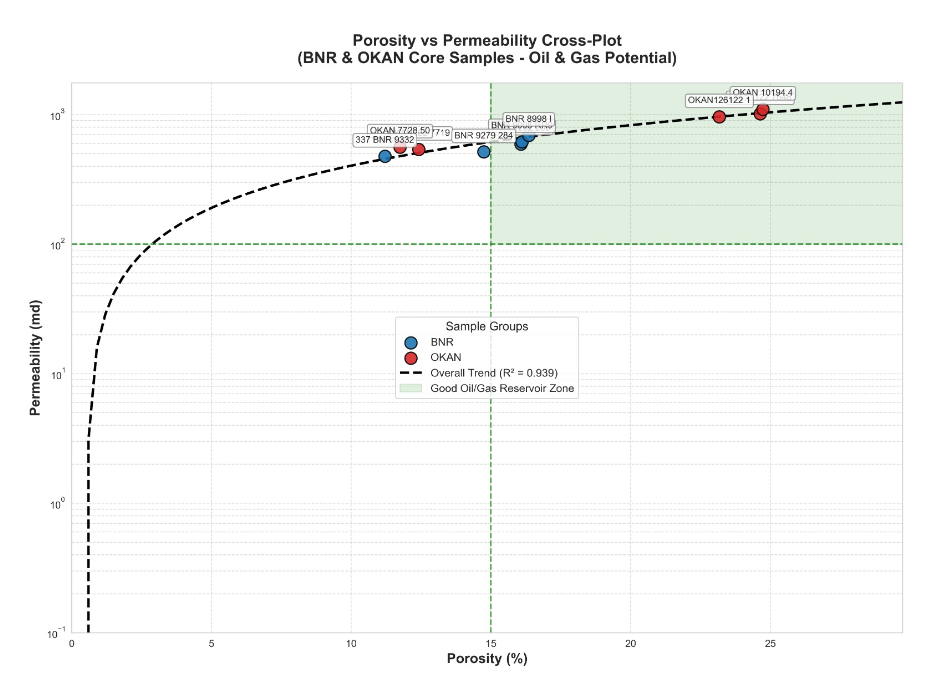
Python-powered cross-plots analyzing core samples from BNR, OKAN, MEREN, and DIBI wells to identify high-potential oil and gas reservoir zones in Petroleum Geology research.
Problem
Core analysis data from multiple wells (BNR, OKAN, MEREN, and DIBI) needed to be analyzed to evaluate reservoir quality and identify zones with high oil and gas potential.
Process
Loaded and cleaned geological core data using Python (pandas) Filtered samples by formation (BNR, OKAN, MEREN, DIBI) Generated porosity-permeability cross-plots using matplotlib and seaborn Added trend lines, statistical analysis (R²), and highlighted good reservoir zones (Porosity >15%, Permeability >100 md)
Lessons Learned
Proper data cleaning is essential when working with geological datasets due to inconsistent naming and formatting Cross-plots are powerful for visualizing reservoir relationships and supporting geological interpretation Python significantly improves efficiency and professionalism compared to manual Excel plotting