HR Analytics Dashboard - Employee Performance & Attrition Insights
Interactive HR dashboard built to analyze employee performance, attrition risk, and workforce trends using Power BI.
Problem
The HR department wanted to understand workforce trends, employee demographics, job satisfaction, and factors driving attrition in order to reduce turnover and improve retention strategies.
Process
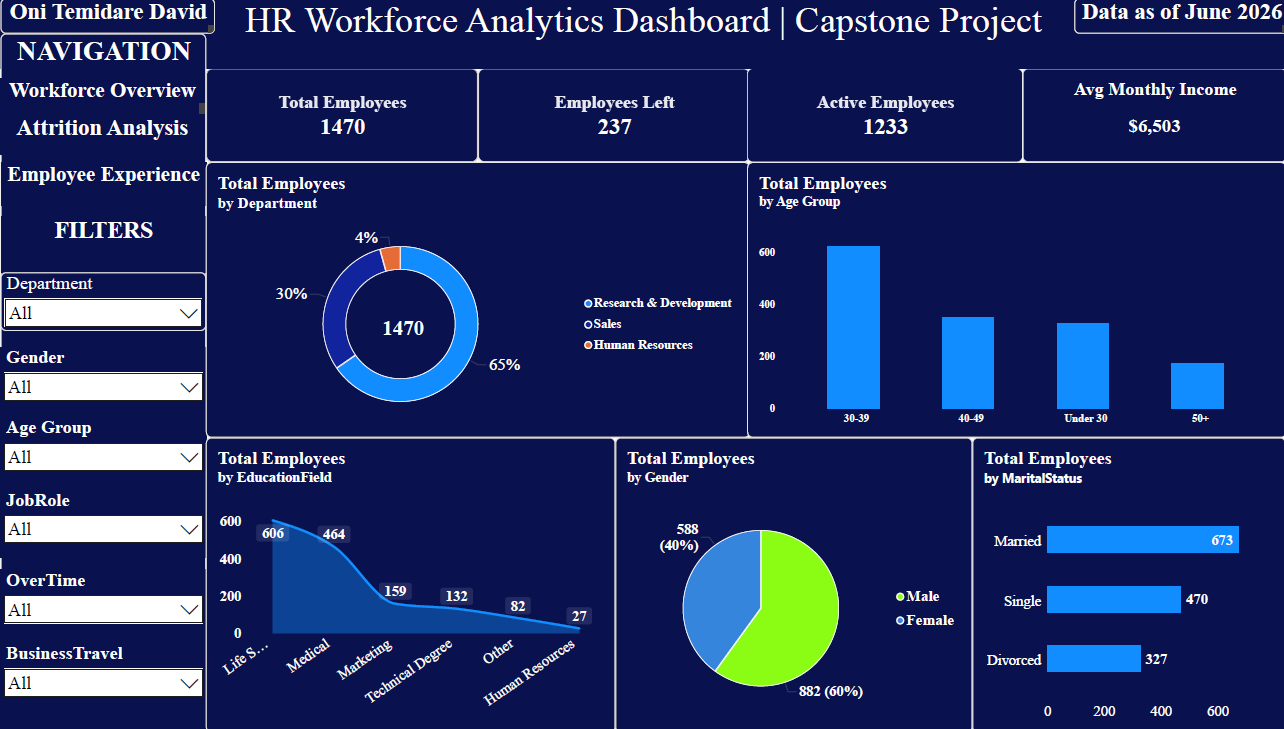
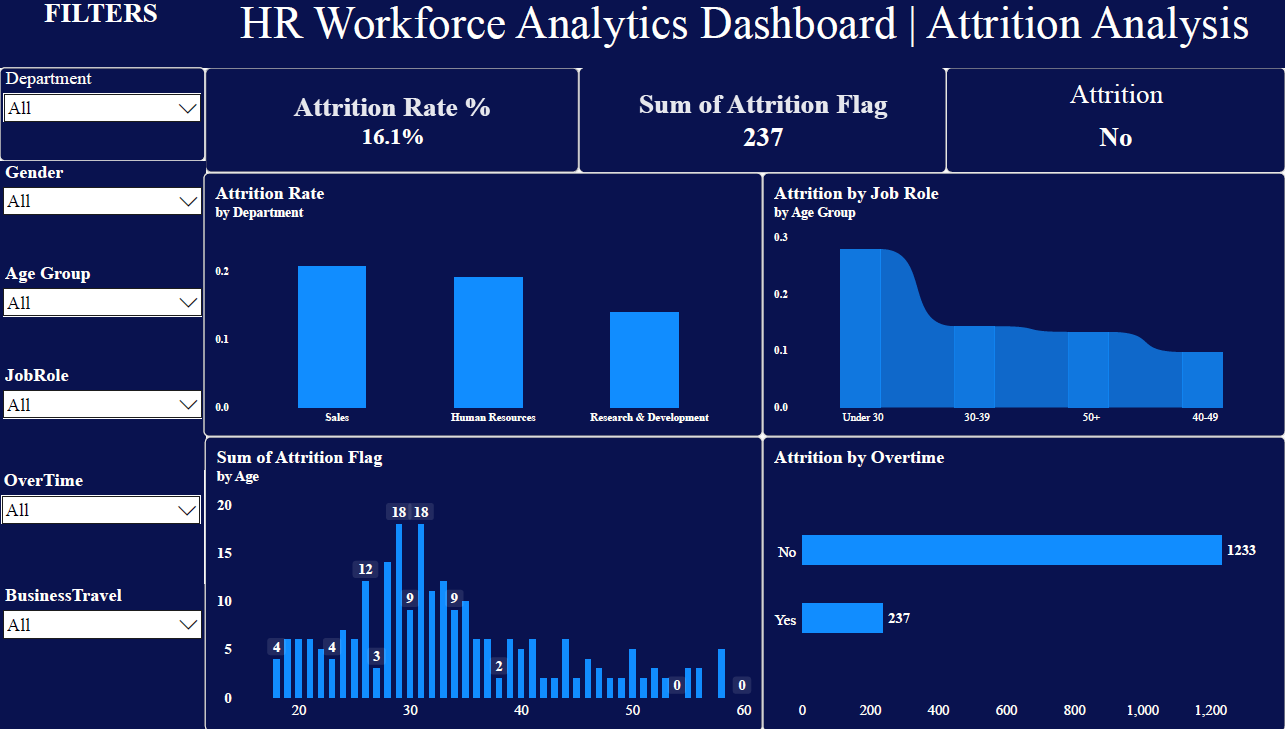
Imported and cleaned the HR Employee Attrition dataset (1,470 records). Created calculated columns: Age Group and Attrition Flag. Built DAX measures for KPIs (Total Employees, Employees Left, Attrition Rate %, Average Monthly Income, etc.). Designed a clean 3-page interactive professional dashboard: Page 1: Workforce Overview (demographics + KPIs) Page 2: Attrition Analysis (turnover by department, role, age, gender, overtime) Page 3: Employee Experience (job satisfaction, work-life balance, income, promotion insights) Added slicers for full interactivity.
Lessons Learned
The importance of clear layout, consistent colors, and business-focused visuals. How proper DAX measures and context affect chart accuracy. Turning raw data into actionable insights for HR decision-making. Balancing multiple charts while keeping the dashboard easy to understand
##This Power BI HR Workforce Analytics Dashboard has been completed and will be uploaded to my GitHub repository shortly. Other Python-based projects are currently available on my GitHub.
Gallery
Timeline
Completed HR Workforce Analytics Dashboard
Successfully built a clean 3-page interactive Power BI dashboard for HR attrition and workforce analysis. Page 1: Workforce Overview with KPIs and demographics Page 2: Attrition Analysis Page 3: Employee Experience & Retention Insights All pages are fully interactive with slicers. Ready for submission.
7/2/2026