Superstore Sales Analysis
An interactive sales analysis dashboard on Streamlit using Python.
Problem Solved
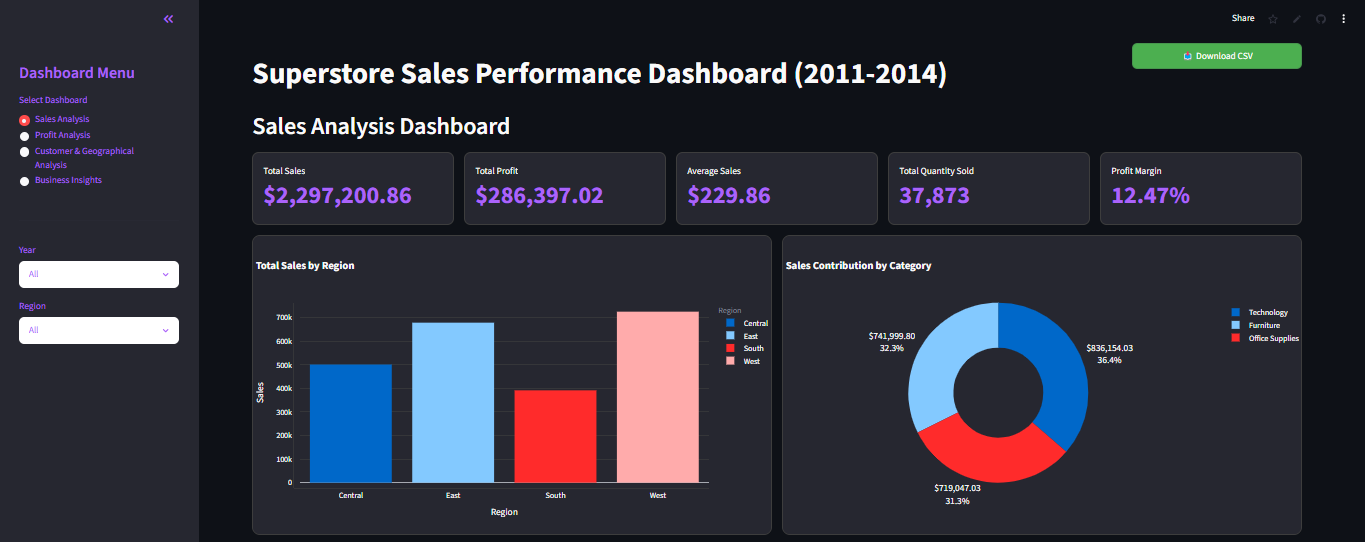
The project helps a retail business understand its sales performance and profitability across regions, products, customer segments, and time so managers can make better decisions about where to grow, where to reduce costs, and which products/customers to focus on.
Process
The project process was: Load and clean the Superstore CSV dataset. Remove duplicate records. Convert order dates into the proper date format. Create new time-based columns such as Month and Year. Build KPIs such as total sales, total profit, average sales, quantity sold, and profit margin. Group the data by region, category, sub-category, city, customer segment, state, and year. Create interactive charts using Plotly. Build a Streamlit dashboard with filters for year and region. Add business insights and recommendations based on the analysis.
Lessons Learned
Dashboards make it easier to turn raw data into business decisions. Data cleaning matters, especially with mixed date formats and duplicate records. Interactive filters help users explore performance by year and region instead of relying on one static report.