Cricket Analytics Report
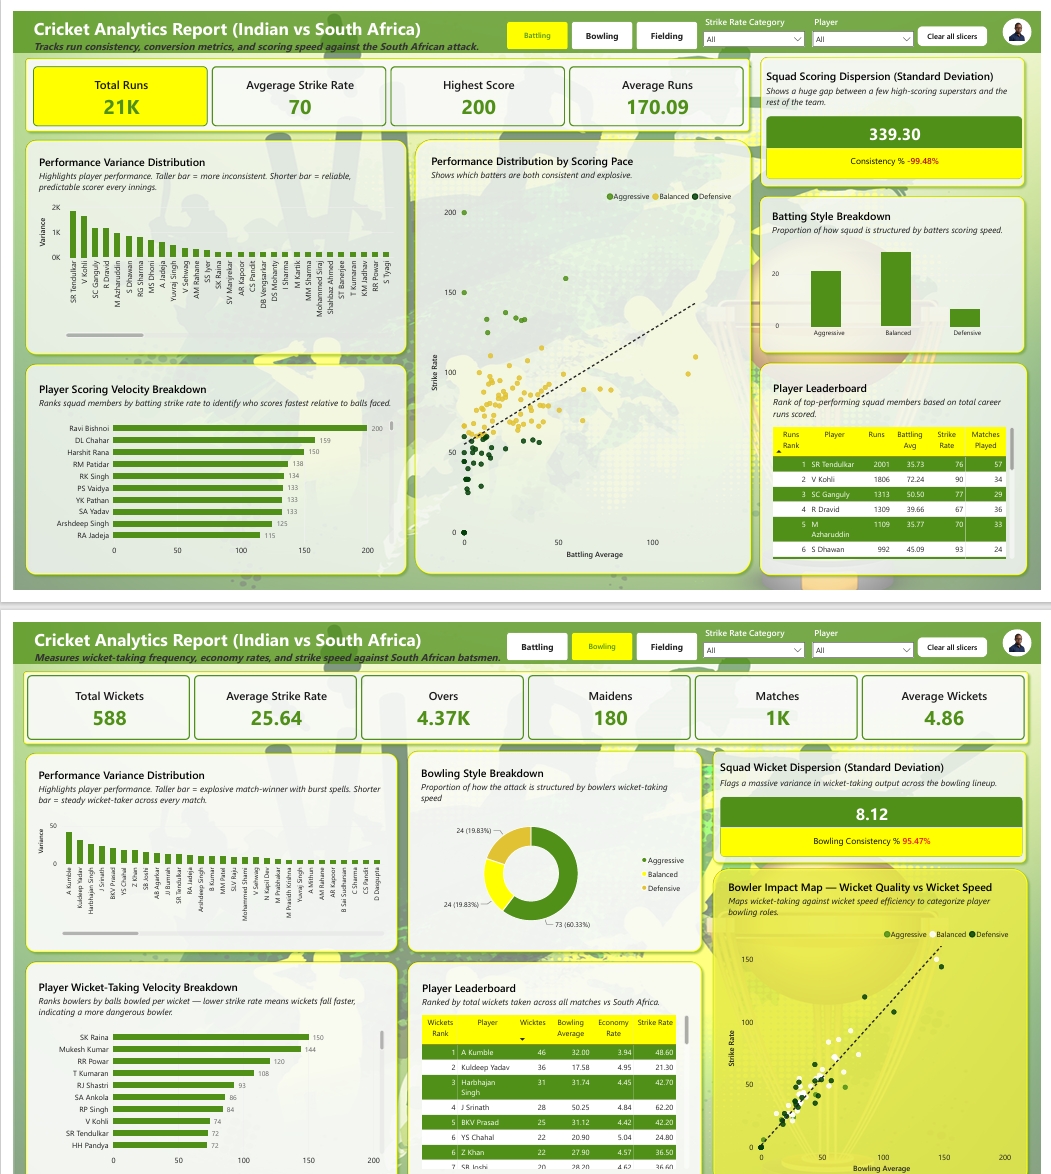
This project analyzes India's cricket performance against South Africa across three disciplines: Batting, Bowling, and Fielding, using real ESPN Cricinfo data. The goal was to move beyond raw scorecards and surface meaningful patterns in player consistency, scoring speed, wicket-taking efficiency, and fielding impact. The dashboard is designed to give coaches, analysts, and cricket enthusiasts a data-driven view of squad performance.
Business Problem
Raw cricket scorecards show what happened in a match but do not explain why. Selectors and analysts need a faster way to identify which players consistently deliver, which are match-winners under pressure, and where the squad has structural weaknesses — across all three disciplines in one place.
Process
The dataset import from web sourced ESPN Cricinfo. It came as three separate tables covering Batting, Bowling, and Fielding statistics for India vs South Africa across multiple match formats and years. Before touching Power BI or writing a single formula, significant time was spent understanding what each column actually meant in the context of cricket. Once the data was understood, it was loaded into Power BI and cleaned using Power Query (M Language)
Lessons Learned
Domain knowledge matters as much as technical skill. Understanding the business behind the data provides real insight.