Customer Bike Sales Behaviour 2
Understanding factors that affect bike sales behaviour of clients (Analysis)
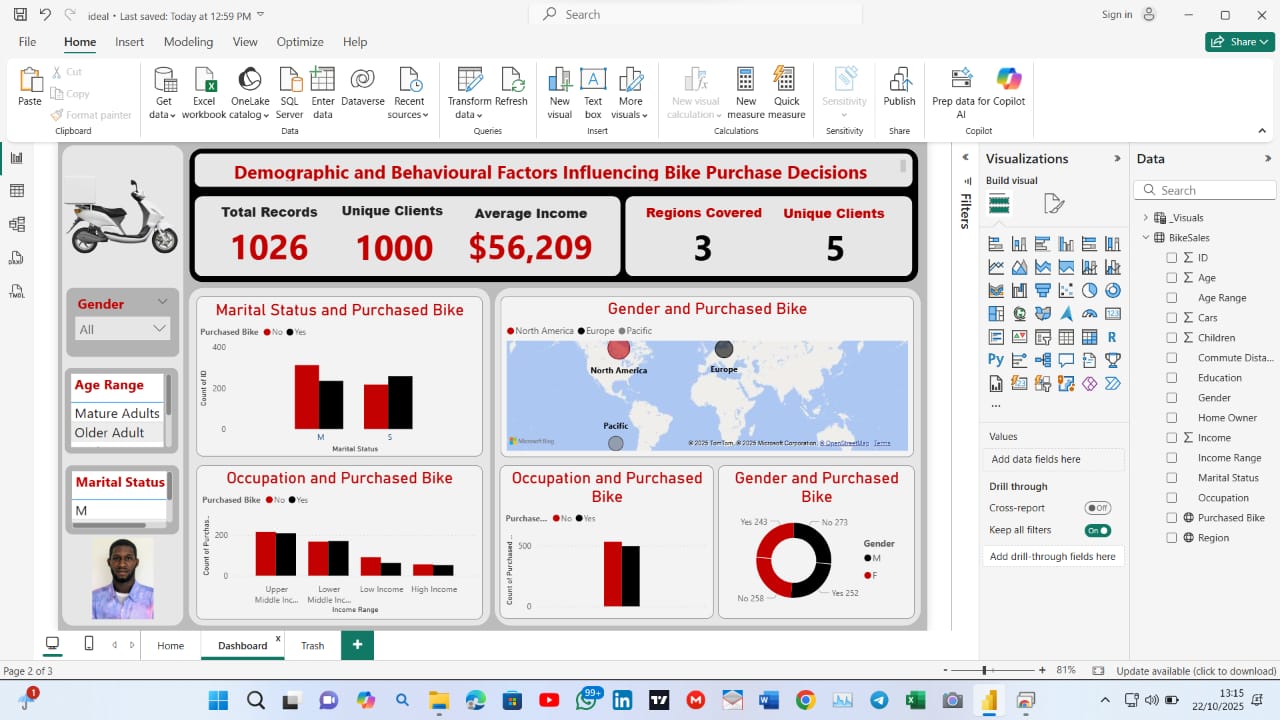
Problem Organizations often collect large volumes of customer demographic and purchasing data but struggle to transform it into meaningful business insights. The objective of this project was to develop an interactive Power BI dashboard that analyzes demographic and behavioral factors influencing bike purchase decisions, enabling stakeholders to identify customer segments with the highest purchase potential and support data-driven marketing strategies.
Key business questions included: • Which demographic groups are most likely to purchase a bike? • How does income influence purchasing behavior? • Does marital status affect bike purchases? • Which regions have the highest bike ownership? • What insights can be gained from customer demographics to improve business decisions?
Process
-
Imported the bike sales dataset into Power BI.
-
Cleaned and transformed the data using Power Query by handling missing values, correcting data types, and ensuring consistency.
-
Created calculated measures and KPIs using DAX, including: • Total Records • Unique Clients • Average Income • Regions Covered
-
Built an interactive dashboard with slicers for: • Gender • Age Range • Marital Status
-
Developed visualizations to analyze purchasing behavior, including: • Clustered column charts for marital status and bike purchases • Income and occupation analysis • Doughnut chart showing purchases by gender • Filled map displaying regional bike ownership
-
Applied consistent formatting, themes, and layout design to improve readability and user experience.
-
Tested dashboard interactivity to ensure slicers dynamically filtered all visuals and KPIs.
Lessons Learned • Power Query is essential for preparing clean and reliable datasets before analysis.
• DAX measures provide dynamic calculations that update automatically with user interactions.
• Interactive dashboards enable users to explore data without modifying the underlying dataset.
• Effective dashboard design improves communication by presenting key metrics in a simple and visually appealing format.
• Customer demographics such as age, income, occupation, marital status, and region significantly influence purchasing behavior and can support targeted marketing decisions.
• Maps and KPI cards provide executives with quick, high-level insights into business performance.
• Power BI combines data transformation, modeling, visualization, and interactivity into a powerful business intelligence solution.
Skills Demonstrated
•Microsoft Power BI
•Power Query (ETL)
•DAX Measures
•Data Cleaning and Transformation
•Data Modeling
•Interactive Dashboard Development
•Data Visualization
•Business Intelligence
•KPI Development
•Analytical and Data-Driven Decision Making