Bobo Benz Workshop Dashboard
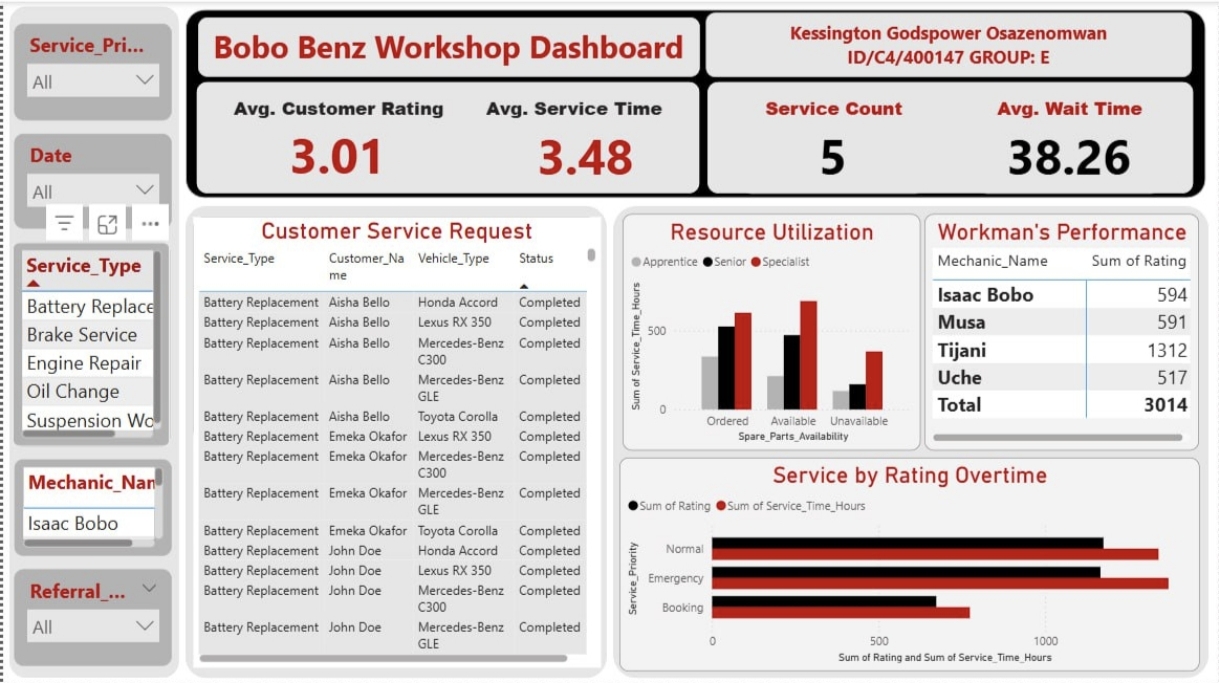
Problem Automotive workshops often struggle to monitor service operations, technician performance, customer satisfaction, and resource utilization using manual reporting methods. The objective of this project was to develop an interactive Power BI dashboard that provides real time insights into workshop performance, helping management optimize service delivery, allocate resources efficiently, and improve customer experience.
Key business questions addressed include:
- What is the average customer satisfaction rating?
- How long does it take to complete services on average?
- What is the average customer waiting time?
- Which mechanics deliver the best performance?
- How effectively are workshop resources being utilized?
- How do service ratings and service times vary across different service priorities?
Process:
- Imported the workshop service dataset into Power BI.
- Cleaned and transformed the data using Power Query by correcting data types, handling missing values, and standardizing records.
- Built a data model and created DAX measures to calculate key performance indicators, including: -Average Customer Rating -Average Service Time -Service Count -Average Wait Time
- Designed an interactive dashboard with slicers for: -Service Priority -Date -Service Type -Mechanic Name -Referral Source
- Developed visualizations including: -KPI cards for operational metrics -Customer service request table -Resource utilization chart -Mechanic performance summary -Service rating versus service time by priority
- Configured interactive filtering so that all visuals update dynamically based on user selections.
- Applied a clean and professional dashboard layout to improve readability and support executive decision making.
Lessons Learned:
- Power BI enables organizations to monitor operational performance through interactive dashboards and real time insights.
- Power Query plays a critical role in preparing clean and reliable data for analysis.
- DAX measures provide dynamic calculations that respond instantly to user interactions.
- Monitoring customer ratings, wait times, and service duration helps identify opportunities to improve service quality.
- Analyzing mechanic performance supports fair workload distribution and performance evaluation.
- Resource utilization analysis helps management optimize workforce planning and operational efficiency.
- Well designed dashboards simplify complex operational data, enabling faster and more informed business decisions.
Skills Demonstrated Microsoft Power BI Power Query (ETL) DAX Measures Data Cleaning and Transformation Data Modeling Interactive Dashboard Development KPI Reporting Operations Performance Analysis Customer Service Analytics Resource Utilization Analysis Data Visualization Business Intelligence Analytical and Data Driven Decision Making