Bike Sales dashboard
Uncover sales conditions of bikes as well as factors affecting sales.
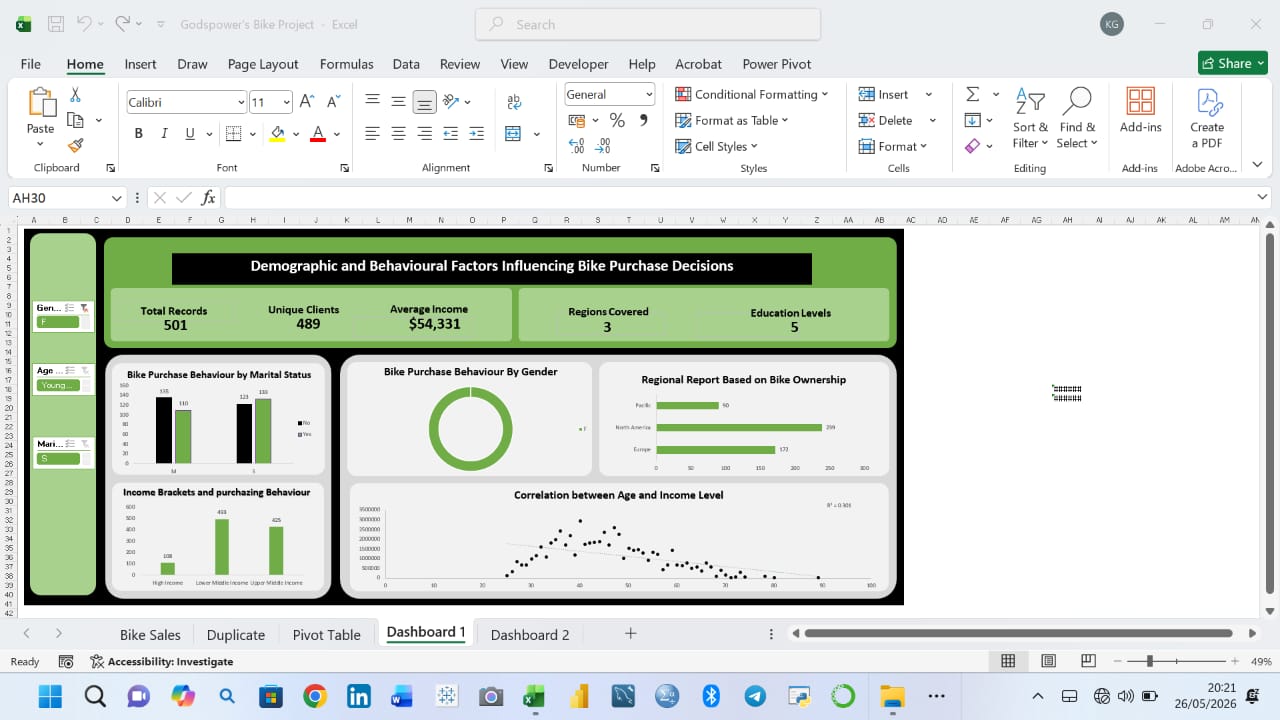
A professional summary of the Problem, Process, and Lessons Learned for the Bike Purchase Analysis project.
Problem The objective of this project was to analyze customer demographic and behavioral data to understand the key factors influencing bike purchase decisions. Businesses often struggle to identify which customer segments are most likely to buy bikes, making it difficult to create targeted marketing strategies and optimize sales efforts.
The project sought to answer questions such as: Which demographic groups are more likely to purchase bikes?
Does income influence purchasing behavior?
How do age, marital status, gender, education, and region affect bike ownership?
Is there a relationship between customer age and income?
Process
-
Collected and explored the bike sales dataset containing customer demographic and purchasing information.
-
Cleaned and prepared the data by removing duplicates, checking for missing values, and standardizing data formats.
-
Created Pivot Tables to summarize key metrics such as: Bike purchases by gender Bike purchases by marital status Regional bike ownership
Income brackets and purchasing behavior
-
Built calculated KPIs, including: Total Records Unique Clients Average Income Regions Covered Education Levels
-
Designed interactive dashboards using Excel with slicers for filtering data by: Gender Age Group Marital Status
-
Created visualizations including: Bar charts Doughnut chart Scatter plot showing the correlation between age and income
-
Formatted the dashboard to improve readability and provide an executive level overview of customer purchasing behavior.
Lessons Learned • Data cleaning is a critical step because inaccurate or duplicate data can lead to misleading insights. • Pivot Tables simplify the analysis of large datasets and make summarizing information more efficient. • Interactive dashboards with slicers improve user experience by allowing quick filtering and exploration of data. • Visualizations make complex data easier to understand and communicate to stakeholders. • Customer demographics such as income, region, marital status, and age provide valuable insights into purchasing behavior. • KPI cards offer an effective way to present high level business metrics at a glance. • Dashboard design is just as important as analysis because clear and well organized visuals improve decision making.
This project strengthened my practical skills in Microsoft Excel, Pivot Tables, Pivot Charts, dashboard design, data visualization, business intelligence, and data-driven decision making.